E-CommerceJune 30, 202610 min read

The Real Cost of a Slow E-Commerce Website: A Data Analysis of 40 Stores

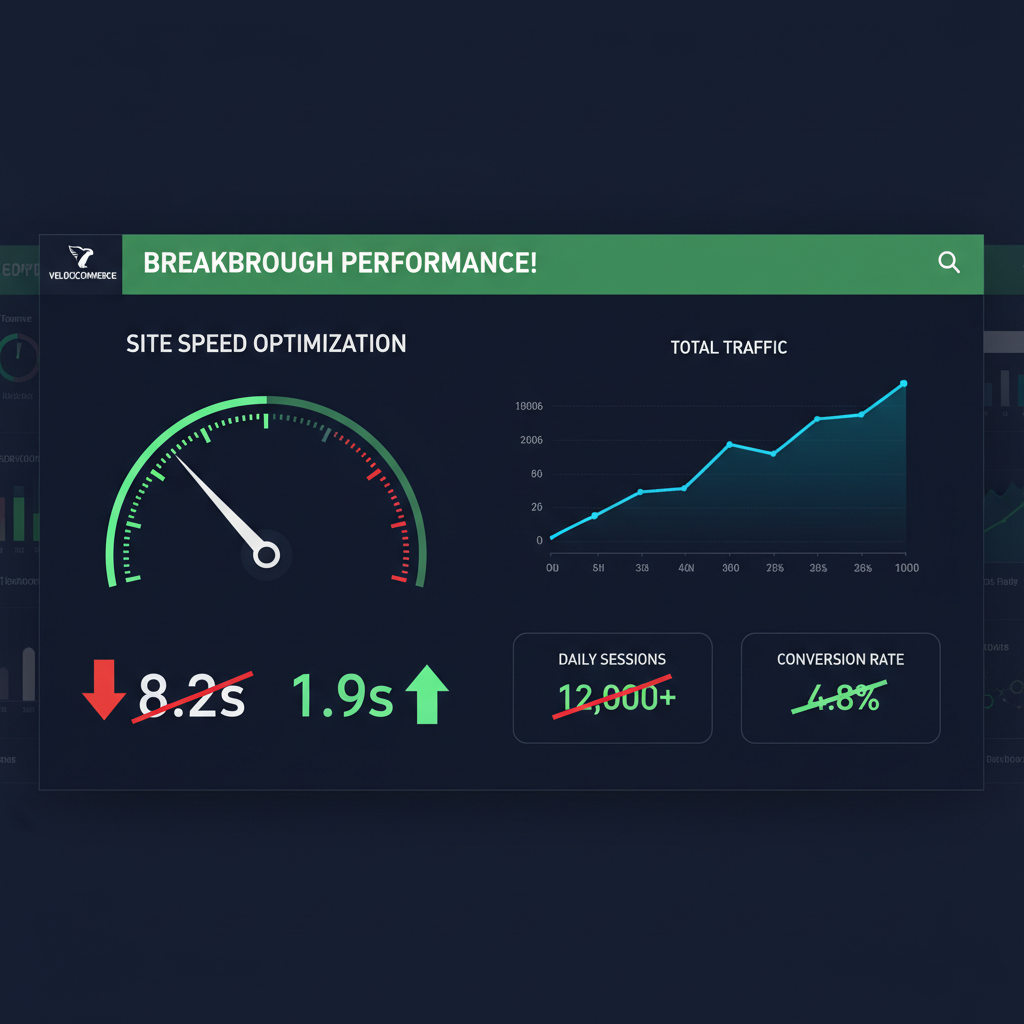
Every 100ms of latency costs roughly 1% in conversions. We analyzed 40 client stores to understand exactly where the money is being lost.

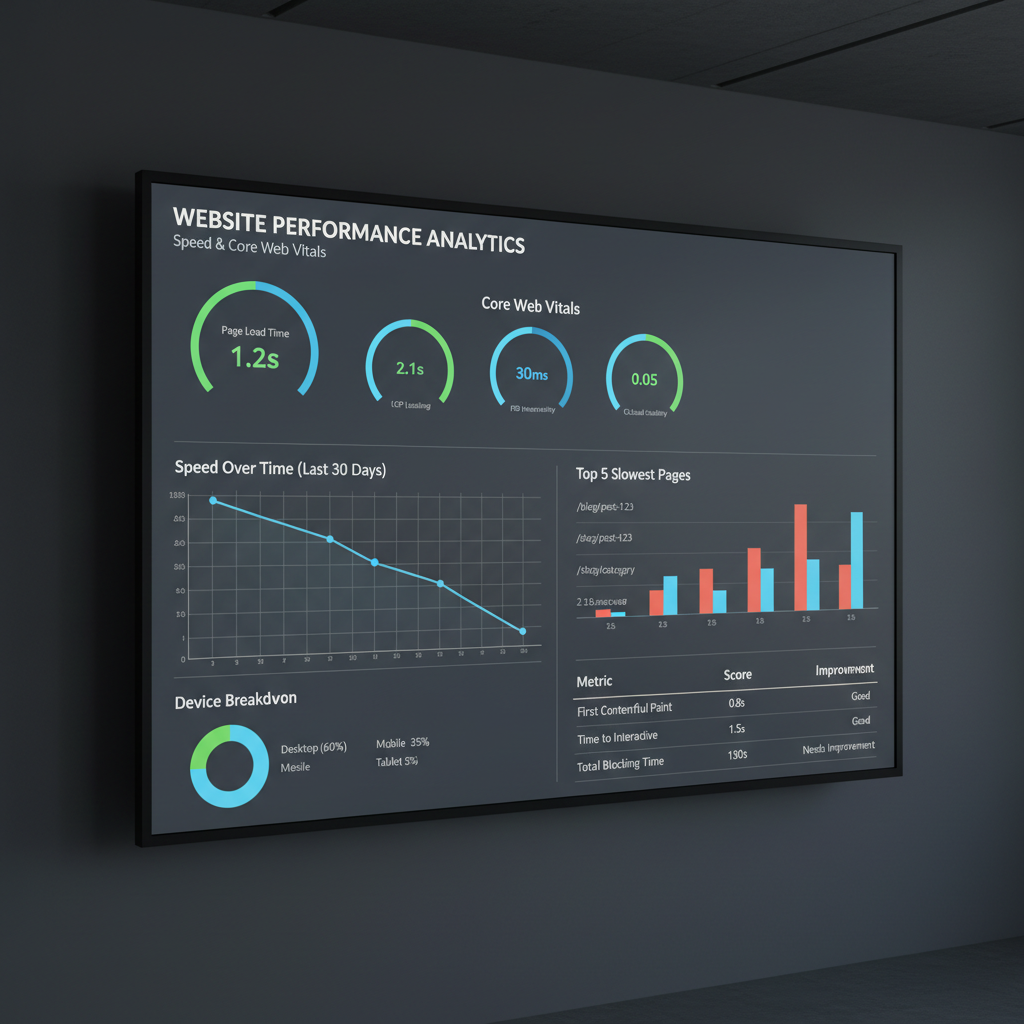
E-commerce analytics dashboard showing conversion rates, revenue metrics, and performance data
Share

The relationship between website performance and e-commerce revenue is well-documented in industry research. This article examines the performance data from a set of e-commerce stores, explores the mechanisms by which slow performance destroys revenue, and provides a practical framework for identifying and fixing the most impactful performance issues.

Product Images: The Biggest Culprit

E-commerce product photography setup showing multiple product images and lifestyle shots
High-quality product images are essential for e-commerce conversion — but they're also the primary source of performance problems.

Product images are the single largest performance problem in most e-commerce stores. They're also the most important conversion element — customers need to see products clearly before buying. This creates a genuine tension between conversion optimization and performance optimization.

The good news: this tension is largely resolvable with modern image optimization techniques.

Common product image problems

  • Unoptimized uploads: Product images uploaded directly from cameras or design tools at 5–20MB each
  • Wrong format: PNG files for product photos (JPEG or WebP is almost always better for photos)
  • No responsive images: Serving 2000px images to mobile devices that display them at 400px
  • No lazy loading: Loading all product images on the category page immediately, even those below the fold
  • No CDN: Serving images from the origin server rather than a CDN edge node

The solution stack

A complete product image optimization stack includes:

  1. Automatic format conversion to WebP/AVIF at upload time
  2. Multiple size variants generated for responsive images
  3. CDN delivery with edge caching
  4. Lazy loading for below-the-fold images
  5. Blur placeholder or skeleton loading for above-the-fold images

Pro Tip: Cloudinary or similar for e-commerce

For e-commerce stores with large product catalogs, a dedicated image CDN (Cloudinary, Imgix, or Cloudflare Images) handles format conversion, resizing, and optimization automatically. The cost is typically far less than the revenue impact of slow product images.

How Speed Affects Conversion Rates

Conversion rate optimization analytics showing funnel drop-off at different page load times
Conversion funnel analysis reveals that performance-related drop-offs occur at every stage — not just the initial page load.

The impact of performance on conversion rates operates through several mechanisms:

Bounce rate

Users who experience slow page loads are significantly more likely to leave before the page finishes loading. According to Google's research, as page load time increases from 1s to 3s, the probability of bounce increases by 32%. From 1s to 5s, it increases by 90%.

Engagement depth

Slow sites reduce the number of pages users visit per session. In e-commerce, more page views generally correlate with higher conversion rates — users who browse more products are more likely to find something they want to buy.

Cart abandonment

Performance issues during the shopping process — slow product page loads, sluggish add-to-cart interactions, slow cart updates — directly increase cart abandonment. The checkout funnel is particularly sensitive to performance.

Return visits

Users who have a poor performance experience are less likely to return. For e-commerce stores that rely on repeat customers, this has a compounding effect on customer lifetime value.

32%increase in bounce probability from 1s to 3s load time

Source: Google/SOASTA research. This figure represents the average across a large dataset of mobile sessions. The impact is typically higher for mobile users on slower connections.

Checkout Performance

E-commerce checkout interface on desktop and mobile showing payment form and order summary
The checkout flow is the highest-value page sequence in any e-commerce store. Performance issues here have an outsized revenue impact.

The checkout flow deserves special attention because it's where the highest-value user actions occur. A user who has added items to their cart has already demonstrated purchase intent — performance issues at this stage are particularly costly.

Common checkout performance problems

  • Heavy payment provider scripts: Payment providers load significant JavaScript. Load these scripts only on checkout pages, not site-wide.
  • Address validation APIs: Real-time address validation can add latency to form interactions. Debounce API calls and show optimistic UI.
  • Slow cart API calls: Cart updates that take 2–3 seconds create a frustrating experience. Implement optimistic updates and background sync.
  • Unoptimized checkout page: Checkout pages often accumulate scripts from analytics, retargeting, and fraud detection tools. Audit and defer everything non-critical.

The checkout performance standard

Checkout pages should meet the same Core Web Vitals thresholds as any other page. INP is particularly important here — users are actively interacting with forms, and slow responses to input events create anxiety during the payment process.

Key Insight: Optimistic UI in checkout

Implementing optimistic UI updates in the checkout flow — showing the expected result immediately while the API call completes in the background — dramatically improves the perceived performance of cart and checkout interactions without requiring any backend changes.

Mobile Commerce Performance

Person shopping on smartphone showing mobile e-commerce interface with product browsing
Mobile commerce accounts for the majority of e-commerce traffic in most markets, but mobile conversion rates remain significantly lower than desktop — partly due to performance.

Mobile commerce (m-commerce) accounts for the majority of e-commerce traffic in most markets, yet mobile conversion rates are typically 2–3x lower than desktop conversion rates. Performance is a significant contributor to this gap.

Mobile-specific performance challenges:

  • CPU constraints: Mid-range mobile devices have significantly less processing power than desktop computers, making JavaScript-heavy pages particularly slow
  • Network variability: Mobile users frequently experience network transitions (WiFi to 4G) and variable signal strength
  • Touch interaction latency: INP is more noticeable on touch devices where users expect immediate visual feedback
  • Viewport differences: Mobile viewports require different image sizes, layout considerations, and interaction patterns

The mobile performance gap is also a conversion opportunity. Stores that invest in mobile performance often see disproportionate conversion improvements because the baseline is lower and the improvement potential is higher.

2–3×lower conversion rate on mobile vs desktop

The mobile-desktop conversion gap is partly attributable to performance, partly to UX differences, and partly to purchase intent differences. Performance improvements alone won't close the entire gap, but they're a significant contributing factor.

Third-Party Scripts in E-Commerce

E-commerce stores typically carry a heavier third-party script load than other website types. A typical e-commerce store might have:

  • Analytics (Google Analytics, Adobe Analytics)
  • Tag management (Google Tag Manager)
  • Retargeting pixels (Facebook, Google, TikTok, Pinterest)
  • Live chat
  • Product review platform
  • Loyalty program
  • Personalization engine
  • A/B testing platform
  • Fraud detection
  • Payment provider scripts

Each of these scripts adds JavaScript execution time, network requests, and potential main thread blocking. The cumulative impact can be severe.

The solution is not to eliminate all third-party scripts — many provide genuine business value. The solution is to:

  1. Audit every script and quantify its performance cost
  2. Require business justification for each script
  3. Defer all non-critical scripts
  4. Load scripts only on pages where they're needed
  5. Use server-side tagging where possible to reduce client-side script load

Warning: Google Tag Manager is not free

Google Tag Manager is free to use, but it's not free in terms of performance. GTM itself adds ~28KB of JavaScript, and every tag loaded through it adds additional weight. A GTM container with 30+ tags can add 500ms–2s of additional load time. Audit your GTM container regularly.

Measuring Performance Impact on Revenue

To make the business case for performance investment, you need to connect performance metrics to revenue metrics. Here's a framework for doing that:

Step 1: Establish performance baselines

Measure current Core Web Vitals using Google Search Console (real-user data) and PageSpeed Insights (lab data). Document LCP, INP, and CLS for your key pages: homepage, category pages, product pages, and checkout.

Step 2: Segment by performance

In Google Analytics 4, create segments based on page load time and compare conversion rates between fast and slow sessions. This gives you a direct measurement of the performance-conversion relationship for your specific store.

Step 3: Calculate the opportunity

Using the performance-conversion relationship you've measured, calculate the revenue impact of improving performance to your target thresholds. This becomes your business case for the optimization investment.

Step 4: Run controlled experiments

Where possible, use A/B testing to measure the impact of specific performance improvements. This provides the most reliable data for decision-making.

Pro Tip: Use GA4 custom dimensions

Set up custom dimensions in Google Analytics 4 to capture Core Web Vitals data alongside conversion events. This allows you to directly correlate performance metrics with revenue metrics in your own data, rather than relying on industry averages.

Optimization Priority Framework

Not all performance optimizations have equal impact. Prioritize based on the combination of impact and implementation effort:

High Impact, Low Effort (Do First)

  • Enable image compression and WebP conversion
  • Add lazy loading to product images
  • Enable CDN for static assets
  • Defer non-critical third-party scripts
  • Enable browser caching with appropriate cache headers

High Impact, Medium Effort (Do Next)

  • Implement responsive images with srcset
  • Optimize and reduce JavaScript bundle size
  • Implement critical CSS inlining
  • Optimize checkout page performance specifically

High Impact, High Effort (Plan Carefully)

  • Migrate to a faster hosting infrastructure
  • Implement edge rendering for dynamic pages
  • Rebuild performance-critical pages with modern frameworks
  • Implement server-side tagging to reduce client-side script load

Bottom Line

Start with the high-impact, low-effort optimizations. They typically deliver 60–70% of the total performance improvement for 10–20% of the total effort. Only move to more complex optimizations after the quick wins are captured.

Implementation Guide

A practical implementation sequence for e-commerce performance optimization:

  1. Audit: Run PageSpeed Insights on your homepage, a category page, a product page, and the checkout page. Document the scores and identify the top 3 issues on each page.
  2. Image optimization: Implement WebP conversion, responsive images, and lazy loading. This is typically the highest-impact change.
  3. Script audit: List every third-party script. For each one, identify: what it does, who requested it, and what the performance cost is. Defer or remove scripts that can't be justified.
  4. Checkout focus: Treat the checkout flow as a separate performance project. Audit it independently and optimize aggressively.
  5. Measure: After each optimization, measure the impact on both performance metrics and business metrics. Document the results.
  6. Iterate: Performance optimization is ongoing. Set up monitoring and review Core Web Vitals data monthly.

Key Insight: Performance is a product feature

The most successful e-commerce teams treat performance as a product feature with its own roadmap, metrics, and ownership — not as a one-time technical project. Assign someone to own performance metrics and include performance in your definition of done for every new feature.

Key Takeaway

Website performance has a direct, measurable impact on e-commerce revenue through its effects on bounce rate, conversion rate, cart abandonment, and customer lifetime value. The highest-ROI optimizations are image optimization (WebP, lazy loading, responsive images), third-party script management, and checkout performance. Measure the impact of every optimization using your own data, not just industry averages.

Found this article useful? Share it:

Share

You May Also Like