PerformanceJuly 28, 20268 min read

10 Core Web Vitals Mistakes That Are Killing Your SEO in 2026

Most agencies ignore INP (Interaction to Next Paint) completely. Here's how to audit and fix the most common performance regressions we see in the wild.

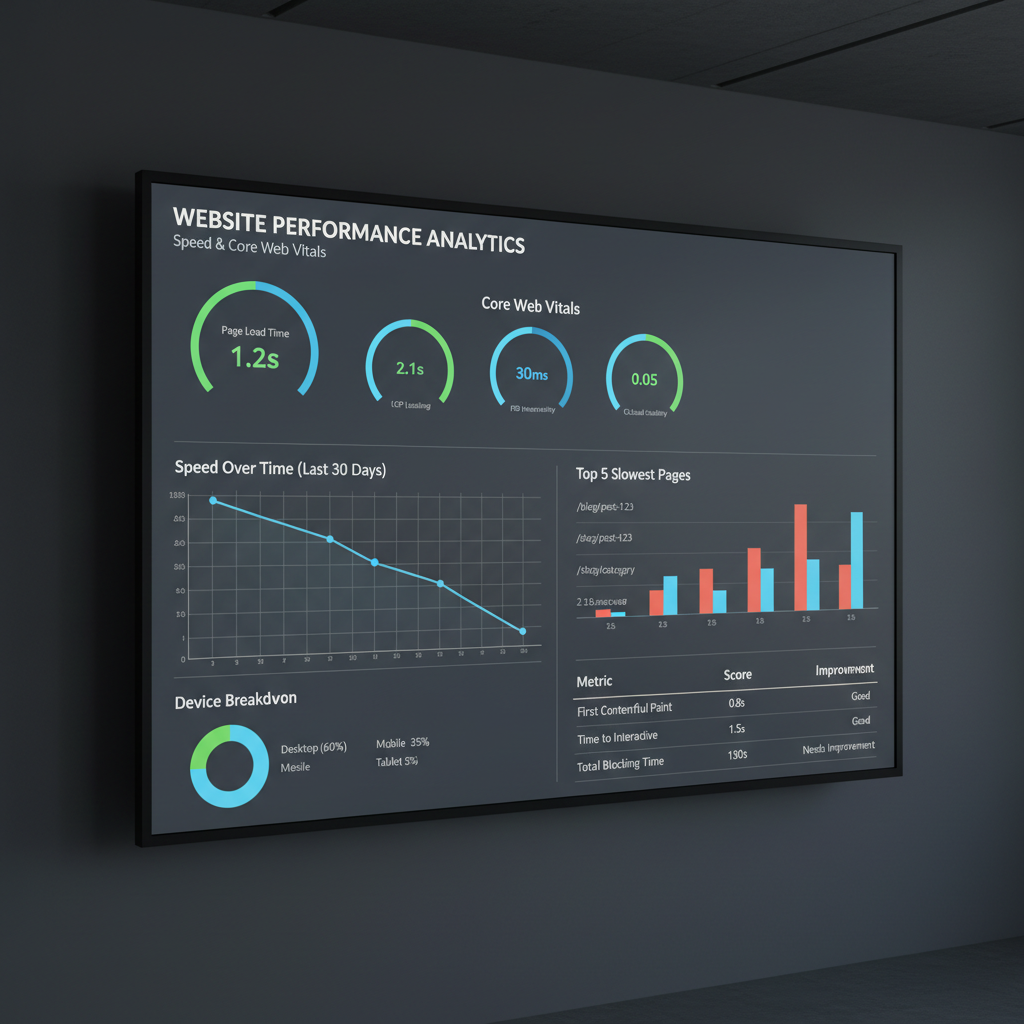
Web performance analytics dashboard showing Core Web Vitals metrics on a monitor
Share

Google's Core Web Vitals have been a ranking signal since 2021, yet the majority of websites still fail at least one metric. In 2026, with INP (Interaction to Next Paint) fully replacing FID as a ranking factor, the stakes are higher than ever. This article breaks down the ten most common mistakes we encounter when auditing websites — and exactly how to fix them.

Why Core Web Vitals Matter in 2026

Google Search Console performance report showing Core Web Vitals scores
Google Search Console now prominently surfaces Core Web Vitals data for every URL.

Core Web Vitals are a set of real-world, user-centric performance metrics that Google uses as a direct ranking signal. They measure three dimensions of user experience: loading performance (LCP), interactivity (INP), and visual stability (CLS).

Since the Page Experience update, sites that fail these thresholds are at a measurable disadvantage in competitive search results. More importantly, poor Core Web Vitals directly correlate with higher bounce rates and lower conversion rates — meaning the cost isn't just SEO, it's revenue.

According to Google's web.dev documentation, the recommended thresholds are:

  • LCP: ≤ 2.5 seconds (Good), ≤ 4.0 seconds (Needs Improvement)
  • INP: ≤ 200ms (Good), ≤ 500ms (Needs Improvement)
  • CLS: ≤ 0.1 (Good), ≤ 0.25 (Needs Improvement)
72%of mobile pages fail at least one Core Web Vital

Despite years of awareness, the majority of websites still fail to meet Google's recommended thresholds on mobile devices.

LCP: The Loading Mistakes

Website loading performance visualization showing time-to-first-byte and render timeline
LCP measures when the largest visible element finishes rendering — typically a hero image or heading.

Largest Contentful Paint (LCP) measures how long it takes for the largest visible element on the page to render. The most common LCP element is a hero image, but it can also be a large heading or video poster.

Mistake #1: Not preloading the LCP image

The single most impactful LCP fix is adding a <link rel="preload"> for your hero image. Without it, the browser discovers the image only after parsing the HTML and CSS — adding hundreds of milliseconds of unnecessary delay.

<link rel="preload" as="image" href="/hero.webp" fetchpriority="high" />

Mistake #2: Serving oversized images

Serving a 3MB JPEG as a hero image when a 120KB WebP would look identical is one of the most common and costly mistakes. Always serve images in modern formats (WebP, AVIF) and at the correct display dimensions.

Mistake #3: Slow server response (TTFB)

If your Time to First Byte (TTFB) exceeds 800ms, your LCP will almost certainly fail regardless of other optimizations. Use a CDN, enable server-side caching, and consider edge rendering for dynamic pages.

Pro Tip: fetchpriority="high"

Add fetchpriority="high" to your LCP image element in addition to the preload link. This tells the browser to prioritize this resource above other images discovered during parsing.

Key Insight

In Next.js, using the <Image> component with priority={true} on your hero image automatically handles preloading and fetchpriority. This single change can improve LCP by 300–600ms on image-heavy pages.

INP: The Interaction Problem

User interacting with a mobile website, tapping buttons and navigating
INP measures the latency of all user interactions — clicks, taps, and keyboard inputs — throughout the page lifecycle.

Interaction to Next Paint (INP) replaced First Input Delay (FID) as a Core Web Vital in March 2024. Unlike FID, which only measured the first interaction, INP measures the worst interaction latency throughout the entire page session. This makes it significantly harder to pass.

Mistake #4: Long JavaScript tasks blocking the main thread

The most common INP failure cause is long tasks on the main thread. When JavaScript runs for more than 50ms without yielding, any user interaction during that time will be delayed. Use Chrome DevTools' Performance panel to identify tasks exceeding 50ms.

The fix is to break long tasks into smaller chunks using scheduler.yield() or setTimeout(fn, 0):

async function processLargeDataset(items) {
  for (const item of items) {
    processItem(item);
    // Yield to the browser every 50 items
    if (index % 50 === 0) await scheduler.yield();
  }
}

Mistake #5: Synchronous event handlers doing too much work

Event handlers that perform DOM manipulation, state updates, and API calls synchronously will block the main thread. Move expensive work to requestAnimationFrame or defer it with queueMicrotask.

200msRecommended INP threshold (Good)

Any interaction taking longer than 200ms to produce a visual response is considered "Needs Improvement." Above 500ms is classified as "Poor" by Google.

Warning: React hydration can spike INP

Heavy React hydration on page load is a leading cause of INP failures. When the browser is busy hydrating a large component tree, user interactions are queued and delayed. Consider partial hydration, lazy component loading, or React Server Components to reduce hydration cost.

CLS: Layout Shift Culprits

Web design layout showing elements shifting position during page load
CLS measures unexpected layout shifts — when elements move after the page appears to have loaded.

Cumulative Layout Shift (CLS) measures the visual stability of a page. A high CLS score means elements are jumping around after the page loads — a frustrating experience that can cause users to accidentally click the wrong element.

Mistake #6: Images without explicit dimensions

The most common CLS cause is images without width and height attributes. Without these, the browser doesn't know how much space to reserve, so the layout shifts when the image loads.

<!-- Bad: causes layout shift -->
<img src="hero.jpg" alt="Hero" />

<!-- Good: reserves space -->
<img src="hero.jpg" alt="Hero" width="1200" height="630" />

Mistake #7: Dynamically injected content above the fold

Cookie banners, notification bars, and ad slots that load after the initial render push content down, causing significant layout shifts. Always reserve space for these elements using CSS min-height or skeleton placeholders.

Mistake #8: Web fonts causing FOUT/FOIT

When custom fonts load after the page renders, text reflows as the font metrics change. Use font-display: optional or font-display: swap with proper fallback font metrics to minimize layout shift.

Important: aspect-ratio CSS property

Use the CSS aspect-ratio property to reserve space for images and videos even when explicit width/height attributes aren't practical. For example: aspect-ratio: 16/9 on a video container prevents layout shift as the video loads.

Image Optimization Failures

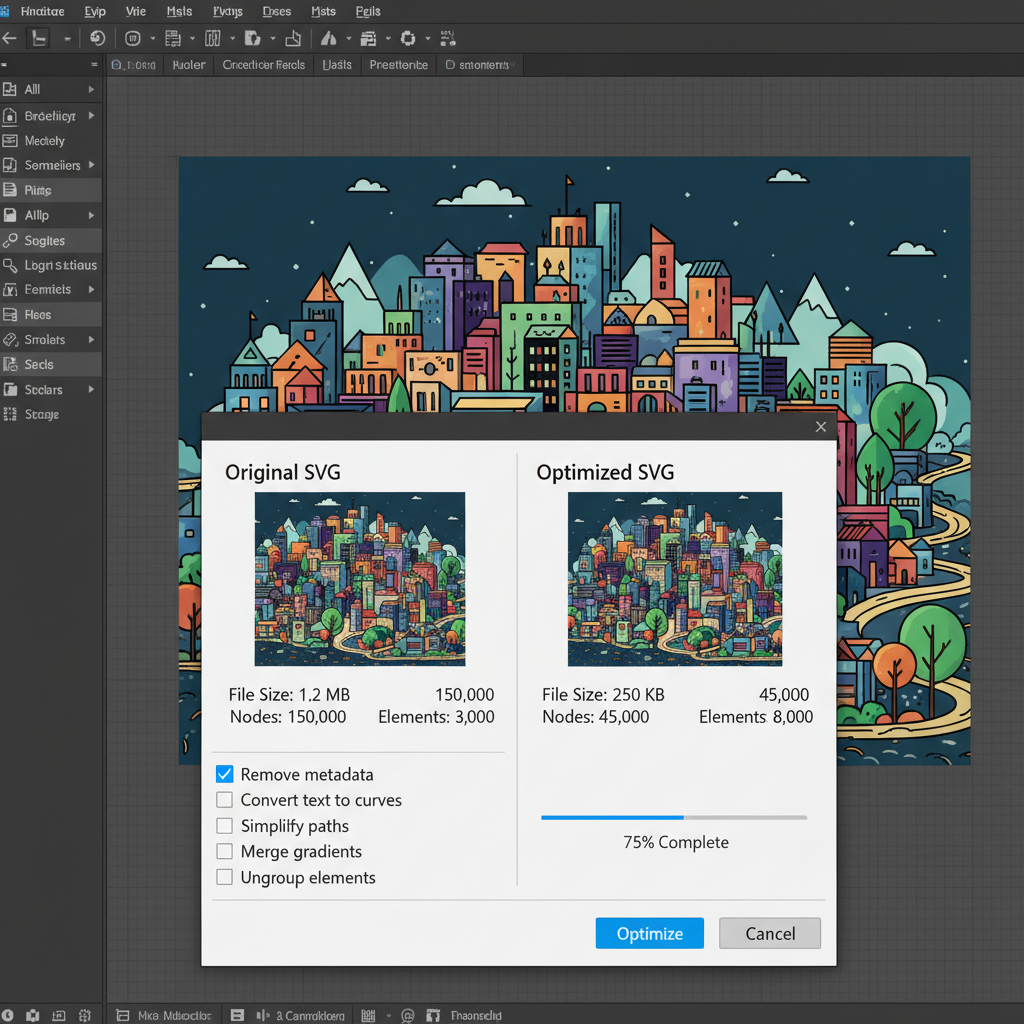
Image compression and optimization workflow showing before and after file sizes
Modern image formats like WebP and AVIF can reduce file sizes by 30–80% compared to JPEG at equivalent visual quality.

Images typically account for 50–70% of a webpage's total byte weight. Optimizing them is the highest-leverage performance improvement available to most websites.

Mistake #9: Not using modern image formats

JPEG and PNG are legacy formats. WebP offers 25–35% smaller file sizes than JPEG at equivalent quality. AVIF offers an additional 20–30% reduction over WebP. Both are now supported by all major browsers.

In Next.js, the <Image> component automatically serves WebP/AVIF to supported browsers. For other frameworks, use a build-time image optimization pipeline or a CDN with automatic format conversion.

Additionally, always implement lazy loading for below-the-fold images:

<img src="content.webp" alt="Content" loading="lazy" decoding="async" />

Bottom Line

For most websites, switching from JPEG to WebP/AVIF and implementing lazy loading for below-the-fold images will reduce total page weight by 40–60% and improve LCP by 0.5–1.5 seconds. This is the single highest-ROI optimization available.

JavaScript Bloat

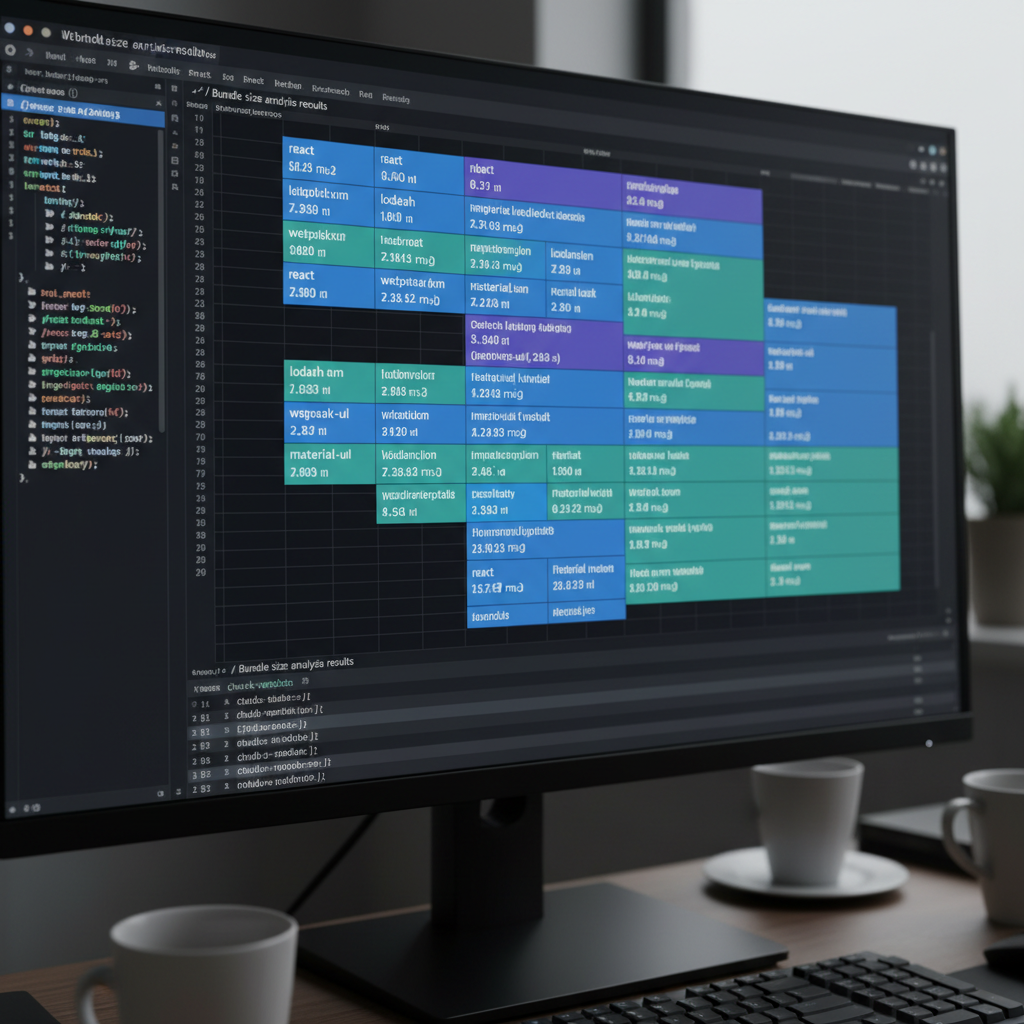
Code editor showing JavaScript bundle analysis with large dependency sizes
JavaScript bundle analysis tools like webpack-bundle-analyzer reveal which dependencies are consuming the most bytes.

Excessive JavaScript is the leading cause of poor INP and slow LCP. Every kilobyte of JavaScript must be downloaded, parsed, compiled, and executed — all on the main thread.

Common sources of JavaScript bloat include:

  • Unused dependencies: Libraries imported but only partially used (e.g., importing all of lodash for one function)
  • Duplicate dependencies: Multiple versions of the same library bundled together
  • Large UI component libraries: Importing an entire component library when only 3 components are used
  • Polyfills for modern browsers: Serving ES5 polyfills to browsers that support ES2022+

Use next/dynamic with ssr: false for heavy client-side components that aren't needed on initial render:

const HeavyChart = dynamic(() => import('./HeavyChart'), {
  ssr: false,
  loading: () => <ChartSkeleton />,
});

Key Insight: Tree Shaking

Named imports enable tree shaking — the bundler can eliminate unused code. Always prefer named imports over default imports for large libraries. Replace import _ from lodash with import { debounce } from lodash-es to import only what you need.

Third-Party Script Overload

Third-party scripts — analytics, chat widgets, ad networks, social embeds — are among the most common causes of poor Core Web Vitals. They execute on your users' devices but are outside your direct control.

Common offenders include:

  • Multiple analytics tools (Google Analytics + Hotjar + Facebook Pixel + custom tracking)
  • Live chat widgets that load immediately on page load
  • Social media embeds (Twitter/X timelines, Instagram feeds)
  • Ad network scripts

The solution is to defer non-critical third-party scripts until after the page is interactive:

// Next.js Script component with strategy
<Script
  src="https://analytics.example.com/script.js"
  strategy="afterInteractive"
/>

// Or for non-critical scripts
<Script
  src="https://widget.example.com/chat.js"
  strategy="lazyOnload"
/>

Warning: Audit your third-party scripts

Run a WebPageTest or Chrome DevTools trace and look at the "Third-party summary" section. It's common to find 15–25 third-party scripts on a single page, collectively adding 2–5 seconds of blocking time. Each script should be justified by measurable business value.

Mobile Performance Neglect

Mobile phone showing a website with performance metrics overlay
Google measures Core Web Vitals primarily from real-user data on mobile devices. Desktop scores alone are misleading.

Google's Core Web Vitals are measured from real-user data, and the majority of that data comes from mobile devices. A site that scores well on desktop can still fail on mobile due to slower CPUs, constrained memory, and variable network conditions.

Key mobile-specific optimizations:

  • Throttle your testing: Use Chrome DevTools with CPU 4x slowdown and "Slow 3G" network to simulate mid-range mobile conditions
  • Reduce JavaScript execution time: Mobile CPUs are 4–6x slower than desktop at executing JavaScript
  • Optimize touch event handlers: Add passive: true to scroll and touch event listeners to prevent blocking scrolling
  • Use responsive images: Serve appropriately sized images for each screen size using srcset and sizes

"The web is primarily experienced on mobile. If your performance strategy is desktop-first, you're optimizing for the minority of your users." — Google Chrome Team

Font Loading Anti-Patterns

Web fonts are a common source of both LCP delays and CLS. The browser must download the font file before it can render text, and if the font metrics differ from the fallback font, text reflows when the custom font loads.

Best practices for font loading:

  • Self-host fonts: Avoid third-party font CDNs that add DNS lookup and connection overhead
  • Preload critical fonts: Add <link rel="preload" as="font"> for fonts used above the fold
  • Use font-display: swap: Shows fallback text immediately, then swaps to the custom font when loaded
  • Match fallback metrics: Use size-adjust, ascent-override, and descent-override to match fallback font metrics to your custom font, eliminating CLS

In Next.js, use next/font which automatically self-hosts Google Fonts, applies optimal loading strategies, and eliminates layout shift:

import { Plus_Jakarta_Sans } from 'next/font/google';

const jakarta = Plus_Jakarta_Sans({
  subsets: ['latin'],
  display: 'swap',
});

Pro Tip: next/font

Next.js's built-in font optimization (next/font) automatically handles self-hosting, preloading, and fallback metric matching. It's the easiest way to eliminate font-related CLS and LCP delays in a Next.js project.

Final Audit Checklist

Before considering your Core Web Vitals optimization complete, run through this checklist:

LCP Checklist

  • ☑ LCP image has fetchpriority="high" and a preload link
  • ☑ Hero images served in WebP/AVIF format
  • ☑ TTFB under 800ms (use CDN + caching)
  • ☑ No render-blocking CSS or JavaScript above the fold

INP Checklist

  • ☑ No long tasks (>50ms) on the main thread during interaction
  • ☑ Event handlers are lightweight and defer heavy work
  • ☑ React hydration cost minimized with Server Components
  • ☑ Third-party scripts deferred with afterInteractive or lazyOnload

CLS Checklist

  • ☑ All images have explicit width/height attributes
  • ☑ No content injected above the fold after initial render
  • ☑ Font loading uses font-display: swap with matched fallback metrics
  • ☑ Ad slots and dynamic content areas have reserved space

Bottom Line

Core Web Vitals optimization is not a one-time task. Use Google Search Console's Core Web Vitals report to monitor real-user data continuously. Set up alerts for regressions and re-audit after every major deployment.

Key Takeaway

Core Web Vitals are both a ranking signal and a direct measure of user experience. The highest-impact fixes are: preloading your LCP image, eliminating long JavaScript tasks that block INP, reserving space for images and dynamic content to prevent CLS, and deferring third-party scripts. Measure with real-user data from Google Search Console, not just lab tools.

Found this article useful? Share it:

Share

You May Also Like